

State report
George's test report
GeorgeJuly 7, 2026
This study examines the relationship between traits such as grit, growth mindset, and self-control, as demonstrated through students’ activities and work, and their impact on college graduation.

This study examines the relationship between traits such as grit, growth mindset, and self-control, as demonstrated through students’ activities and work, and their impact on college graduation.
Common App’s latest Next Chapter impact report shows the organization’s progress towards its moonshot goal of closing the gap of students from low- and middle-income communities on its platform relative to their peers from high-income communities.

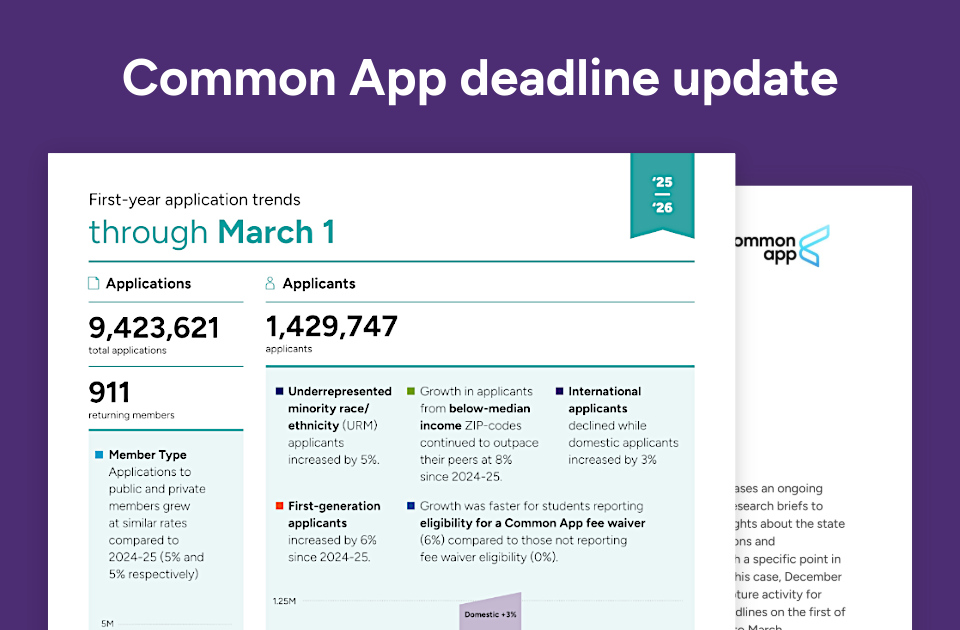
Applicants and applications through March 1, 2026 are up year-over-year, with applicants applying to slightly more schools on average. First-generation applicants increased by 6% compared to this point in 2024-25, and applicants from below-median income ZIP codes grew by 8%.
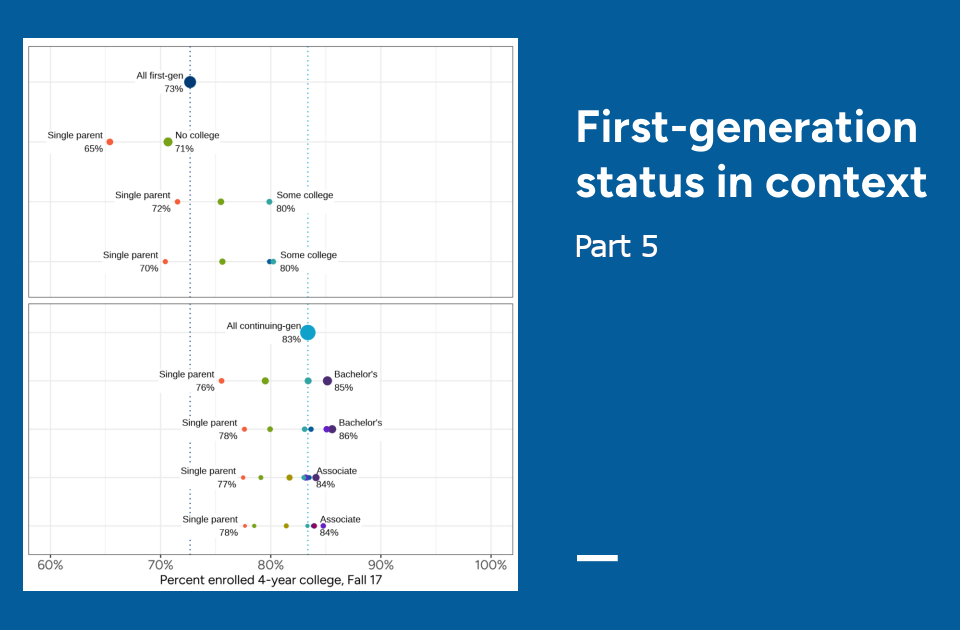
This research brief moves beyond the traditional first-generation binary, analyzing more than 30 specific combinations of parental education to demonstrate significant nuance in college enrollment and degree completion outcomes. The findings, which cluster into four patterns, offer a more precise lens for institutions to identify and tailor support for students.
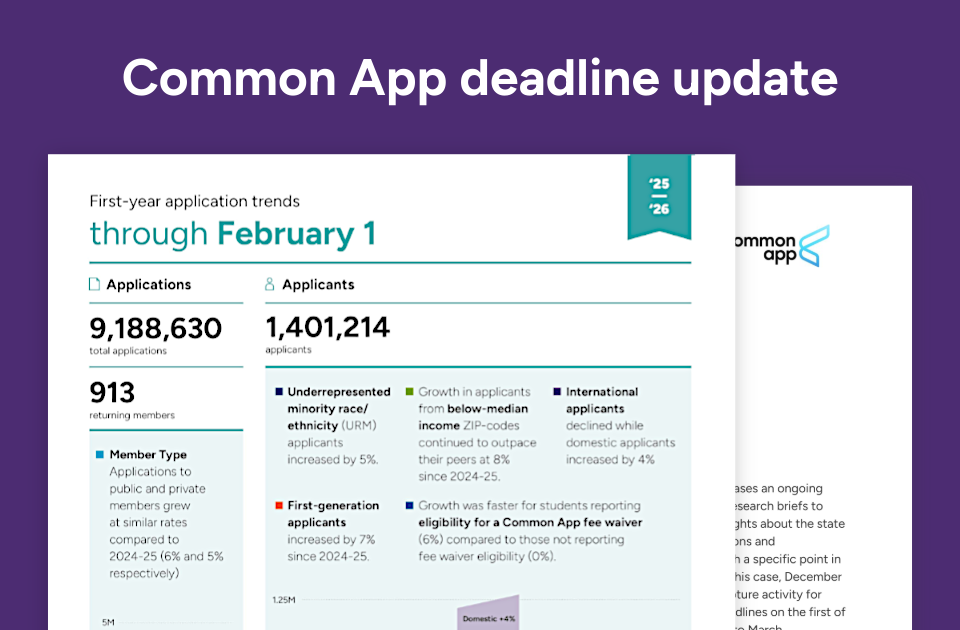
Applicants and applications through February 1, 2026 are up year-over-year, with applicants applying to slightly more schools on average. First-generation applicants increased by 7% compared to this point during 2024-25, and applicants from below-median income ZIP codes grew at 8%.
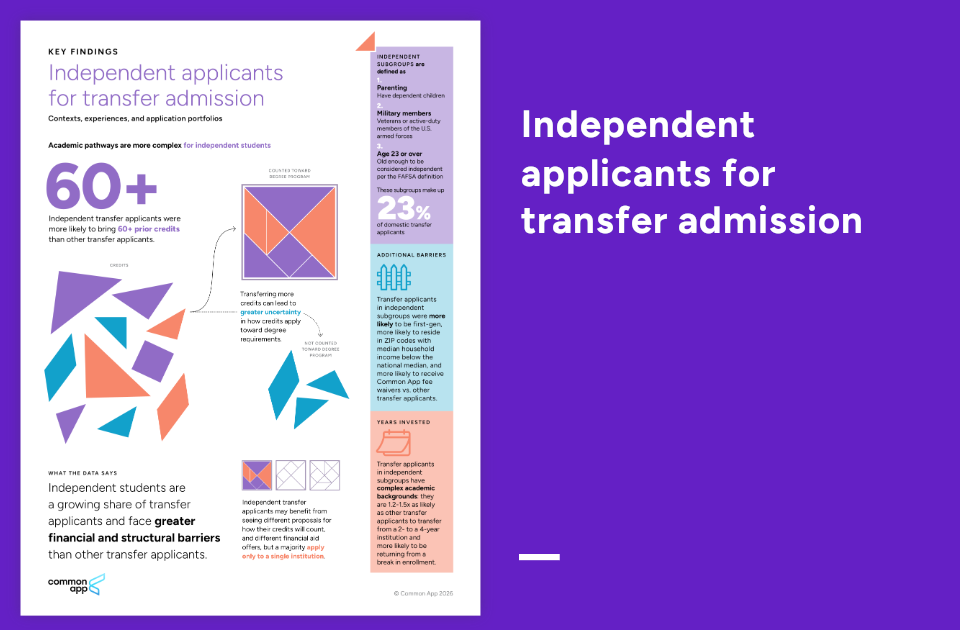
Common App’s research brief examines the academic backgrounds, enrollment pathways, and application behaviors of independent transfer applicants using Common App. It highlights how factors such as prior coursework, time away from college, and proximity to institutions shape where these students apply and what they need to successfully transfer.
Common App’s Annual Report reviews the organization’s activities, achievements, and financial performance for the 2025 fiscal year. It highlights strategic initiatives, research, and programs aimed at increasing access, equity, and integrity in the college admissions process.

Applicants and applications through January 1, 2025 are up year-over-year, with applicants applying to slightly more schools on average. First-generation applicants increased by 9% compared to this point during 2024-25, and applicants from below-median income ZIP codes grew at the same rate.
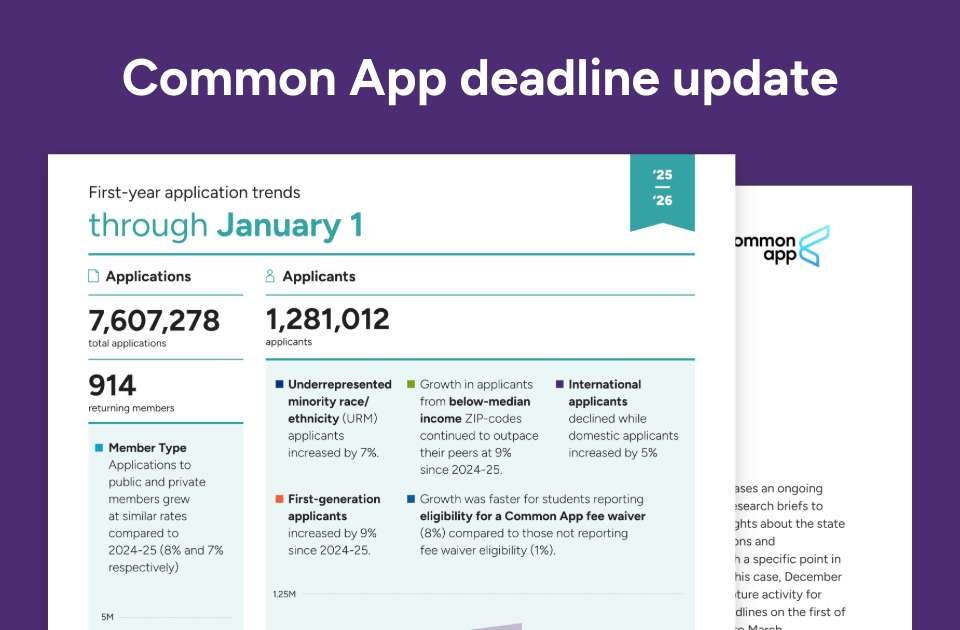
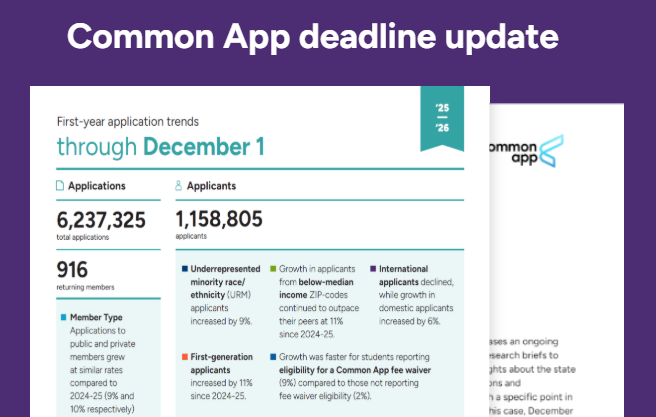
Applicants and applications through December 1, 2025 are up year-over-year, with applicants applying to slightly more schools on average. First-generation applicants increased by 11% compared to this point during 2024-25, and applicants from below-median income ZIP codes grew at the same rate.
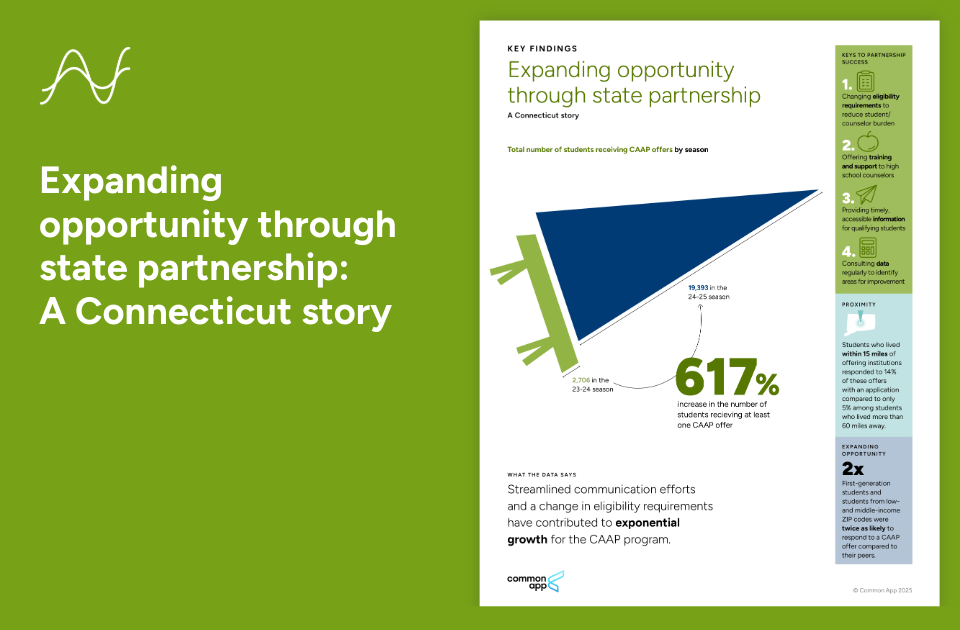
The Connecticut Automatic Admission Program (CAAP) has proven effective at engaging first-generation and low- and middle-income students by simplifying eligibility requirements. Its success highlights how removing application barriers, combined with timely information, significantly strengthens the pathway to college for students who face the greatest obstacles.
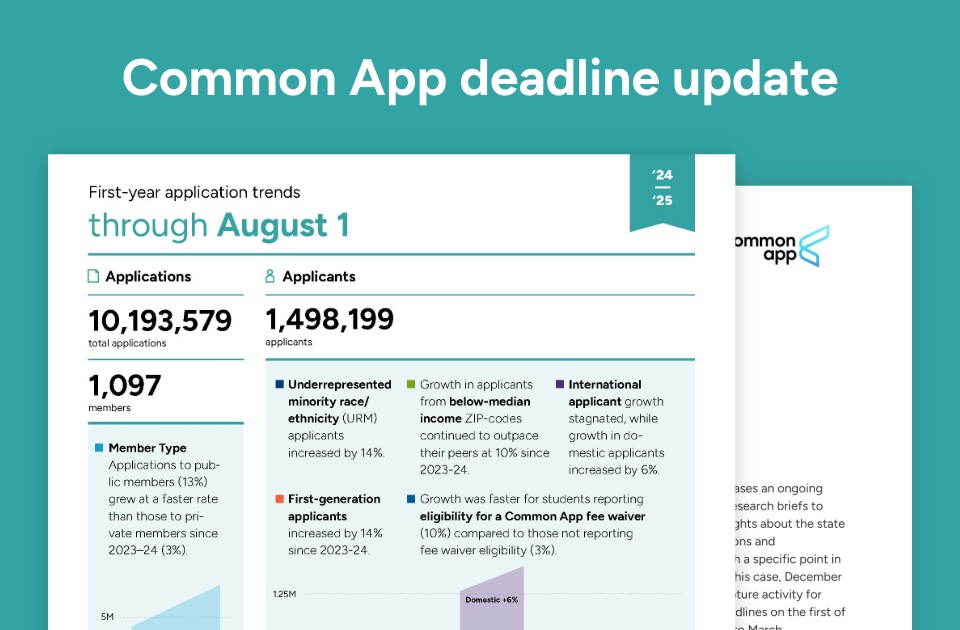
This report provides an early look at first-year college application trends, highlighting shifts in applicant numbers, demographics, and where students are applying. It offers a snapshot of early activity in the current cycle and insights into how application patterns continue to evolve year over year.
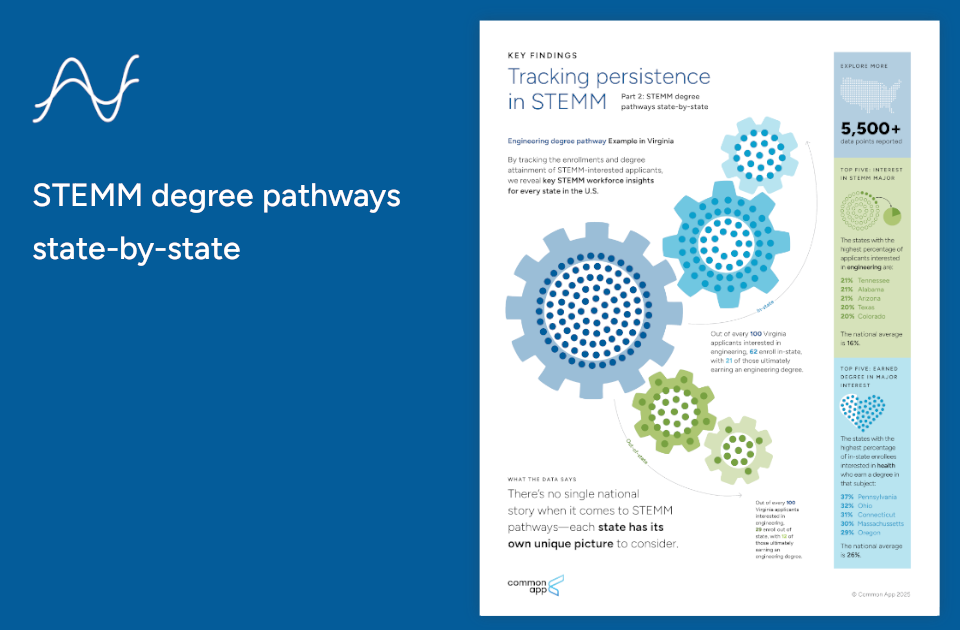
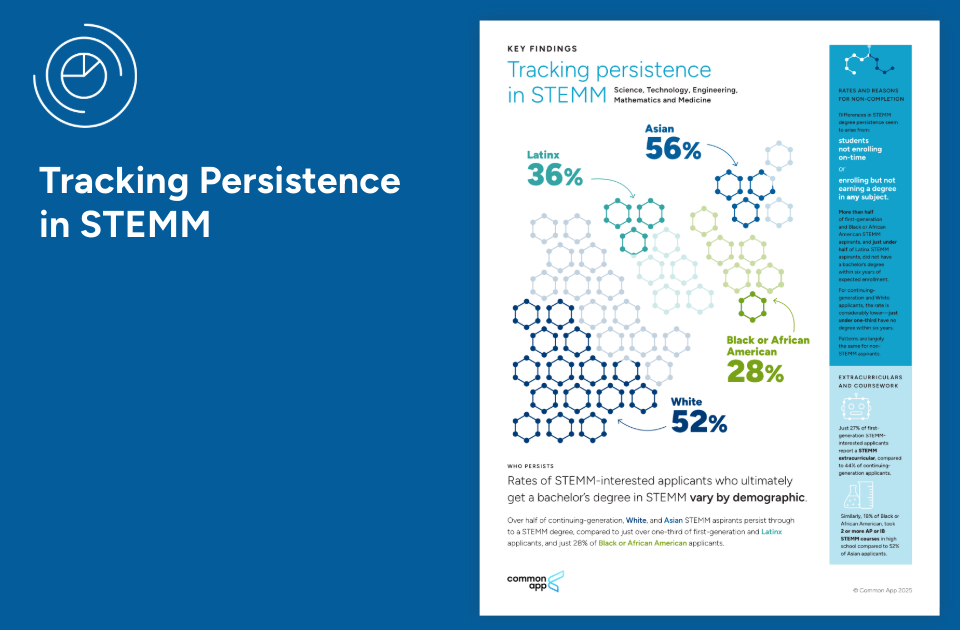
The second brief in the Tracking persistence in STEMM series examines Common App applicants’ STEMM major interests, persistence, and degree completion rates, breaking down outcomes for 50 states, D.C, and Puerto Rico, and 8 STEMM major fields. The brief provides over 5,500 data points, empowering readers to track their own pathways of interest.
This fourth brief in the First-generation status in context series follows 2016–17 Common App applicants through six years of college. It examines enrollment, persistence, and completion to identify where gaps emerge between first-generation and continuing-generation students, as well as the factors that contribute to these gaps.
A comprehensive analysis of the 2024–25 season’s college applications reveals that growth was strongest among Latinx, Black or African American, and first-generation students. Additionally, applicants reporting standardized test scores grew faster than those who did not for the first time since 2021-22, a significant turning point in reporting behavior.
This guide explores new pilots and initiatives aimed at making the college application process more accessible and equitable, while expanding opportunities for underserved students. It also highlights efforts to reduce barriers and strengthen connections to postsecondary pathways.

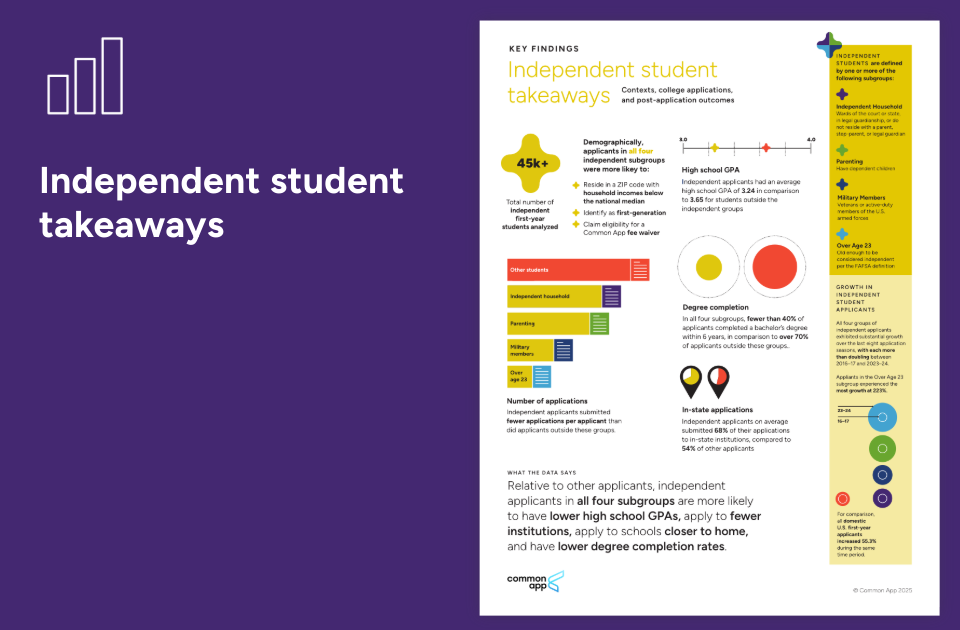
The report examines the unique characteristics, application patterns, and post-application outcomes of independent first-year college applicants. It highlights the challenges faced by these students and emphasizes the need for targeted support to enhance their college success.
In 2023–2024, over 420,000 low- and middle-income students used the platform. Many of whom were first-generation, attended Title I schools, or qualified for fee waivers. Expanded initiatives, such as direct admissions and scholarship matching, have helped increase access for these underserved students.

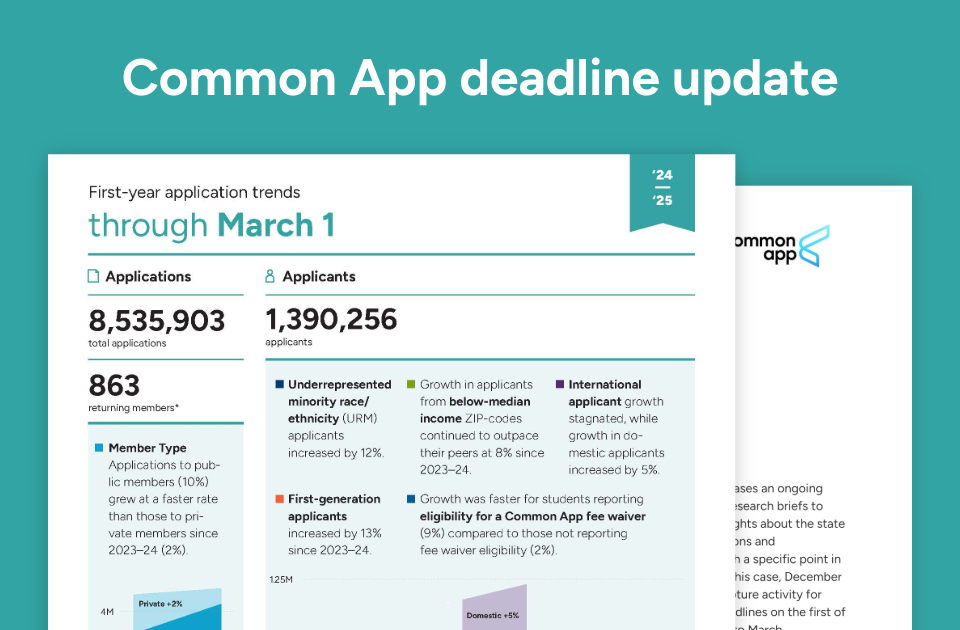
The report provides timely insights on first-year college application trends through March 1. It examines year-over-year shifts in applicant demographics, including race, socioeconomic status, geography, and the types of institutions to which students apply.
Over 786,000 applicants from the 2016–17 application cycle were tracked to examine disparities in STEMM (Science, Technology, Engineering, Mathematics, and Medicine) degree completion across demographic groups.
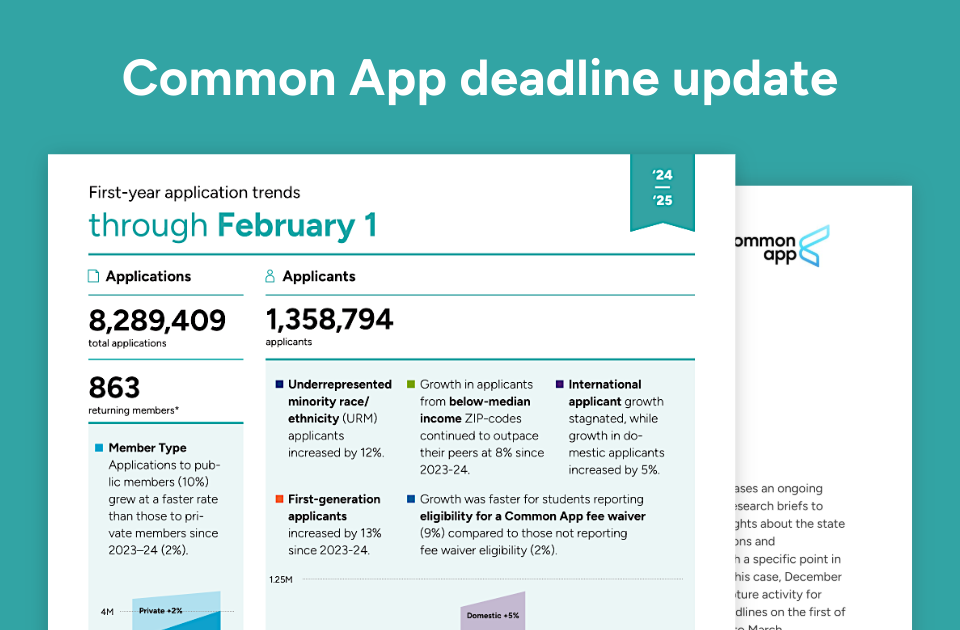
Application activity through February 1, 2025, continued to grow compared to last year, with increases across key applicant groups. The trends indicate an expansion of access and increased diversity in the applicant pool.
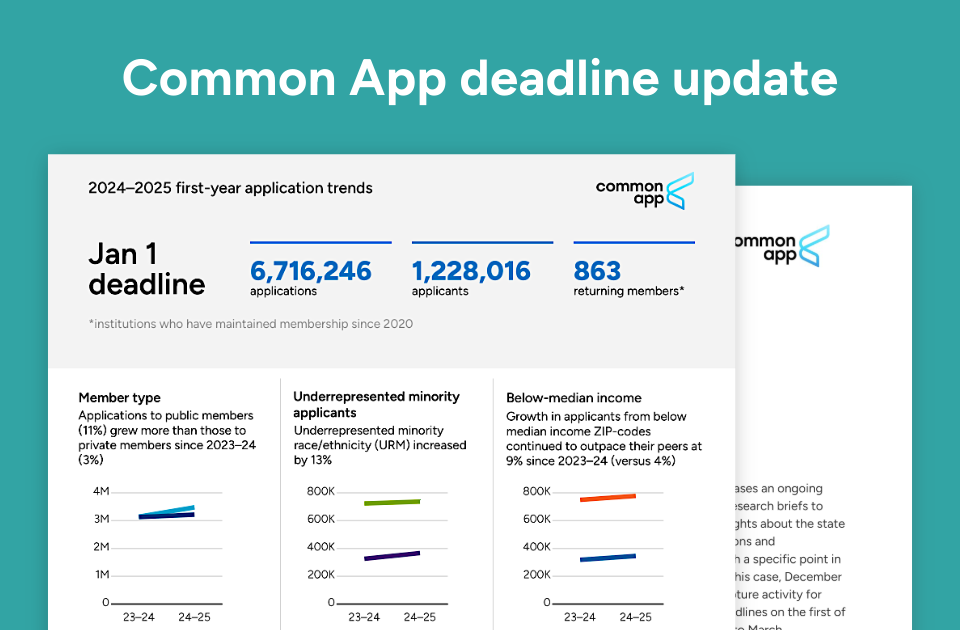
The report shares insights on first-year college application activity through January 1. It highlights year-over-year changes in applicant demographics, socioeconomic indicators, geography, and institutional choice.
This study examines trends in gender identity and pronoun usage among first-year applicants, highlighting shifts in student self-identification and demographic patterns over three application seasons.
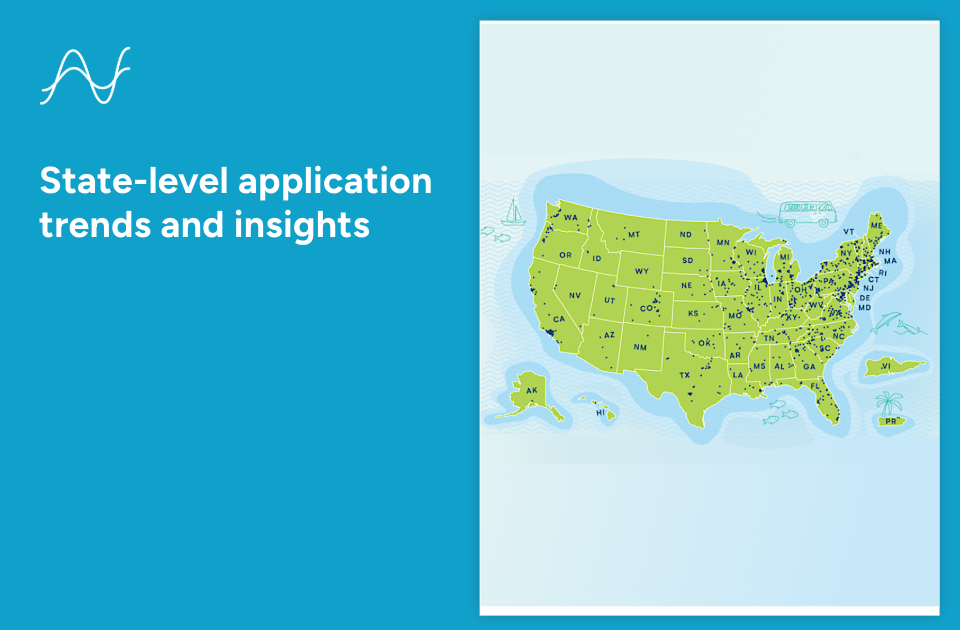
Explore state-specific application trends and demographics for all 50 states, the District of Columbia, the U.S. Armed Forces, and U.S. territories for the 2025–2026 season.
By December 1, 2024, college applications submitted through Common App increased compared to last year, with notable growth across key student groups. Public institutions and certain regions experienced the largest gains, and a higher number of applicants reported test scores compared to previous cycles.
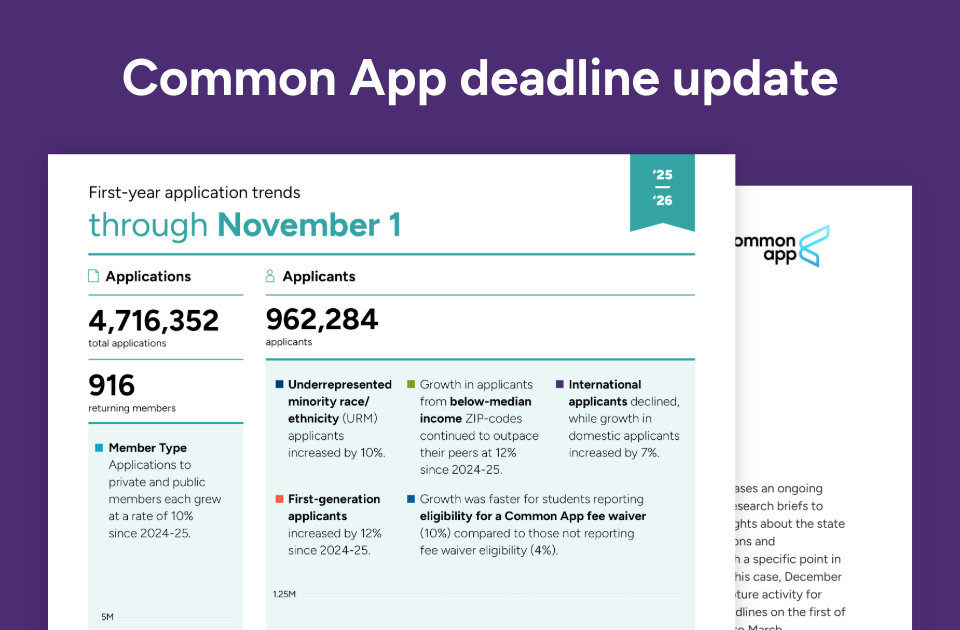
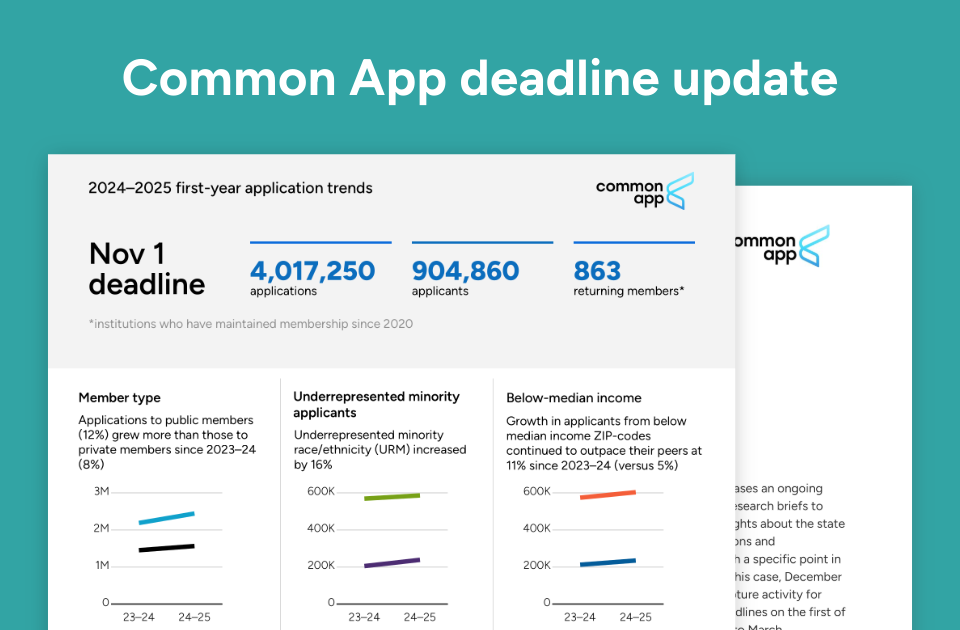
The report provides timely insights on first-year college application trends through November 1. It examines year-over-year shifts in applicant demographics, including race, socioeconomic status, geography, and the types of institutions to which students apply.
Explore Common App's inaugural annual report, showcasing 2024 achievements and our mission to close the equity gap in college admissions by 2030.

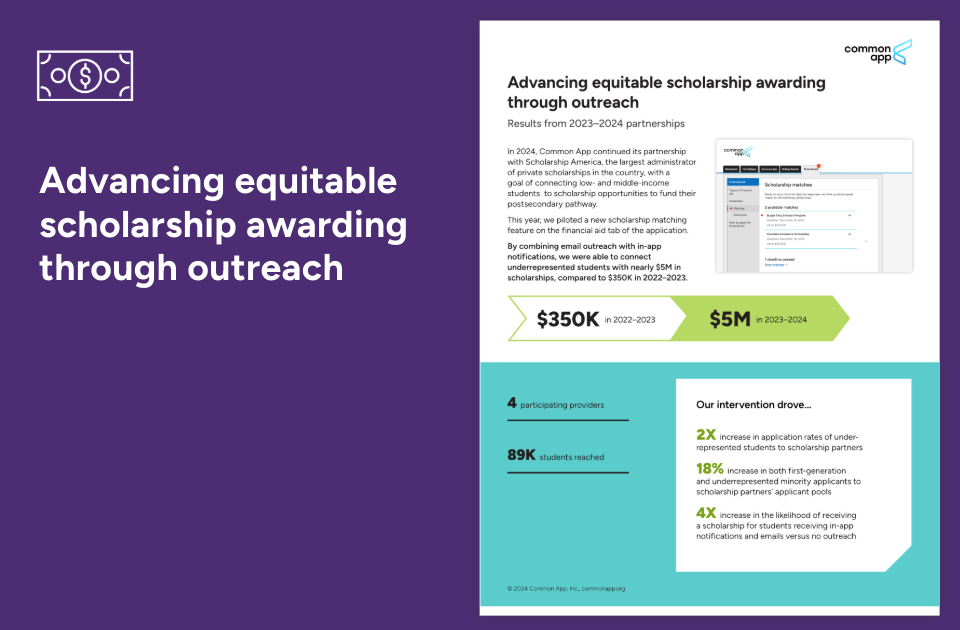
This analysis evaluates the impact of integrated email and in-app notifications on connecting underrepresented students to scholarship opportunities, highlighting significant increases in application rates and scholarship awards.
The 2023–24 Common App season saw 1.43 million first-year applicants submit 9.47 million applications, with notable growth among underrepresented minority, first-generation, and international students.
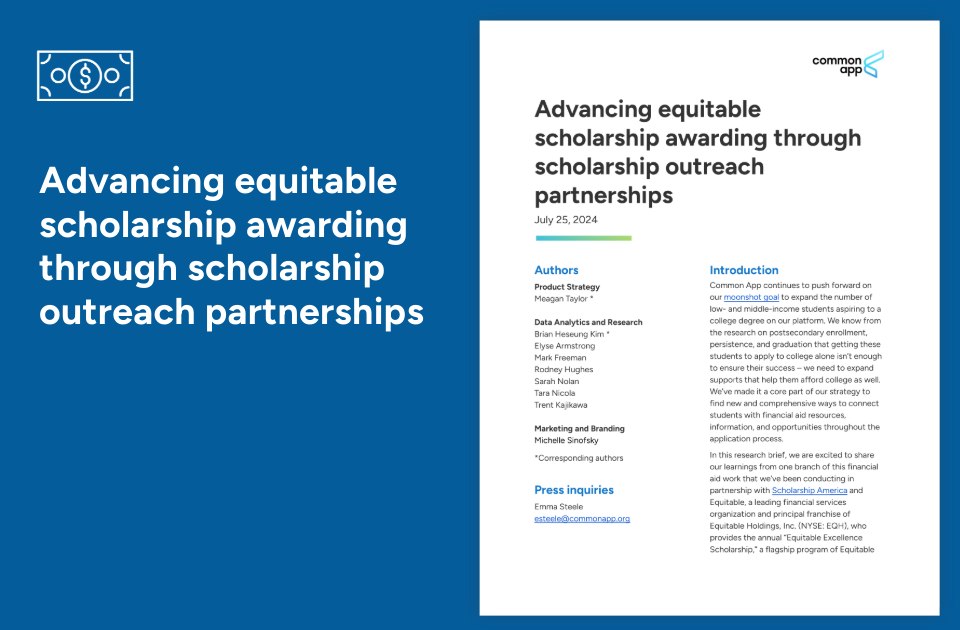
During the 2022–2023 application season, the Common App partnered with Scholarship America and Equitable to expand access to private scholarships for underrepresented students. Through targeted email outreach, the initiative aimed to increase application rates, diversify the applicant pool, and boost scholarship awards.
In the 2023–2024 application cycle, the first full season after the Supreme Court rulings banning race-conscious admissions, Common App observed that students’ racial/ethnic self-identification, application behaviors, and essay content remained consistent with prior seasons. The only notable changes were slight shifts in representation and essay themes among certain groups.
The Equity Innovations Guide highlights new initiatives designed to expand college access for students from low- and middle-income backgrounds, first-generation students, and other groups. It showcases promising pilot programs and collaborations that aim to close equity gaps in the admissions process, helping more students pursue higher education.

The report examines how often students submitted standardized test scores with their Common App applications by March 1, 2024. It breaks this down by groups such as first-generation status, fee-waiver eligibility, and state of residence.
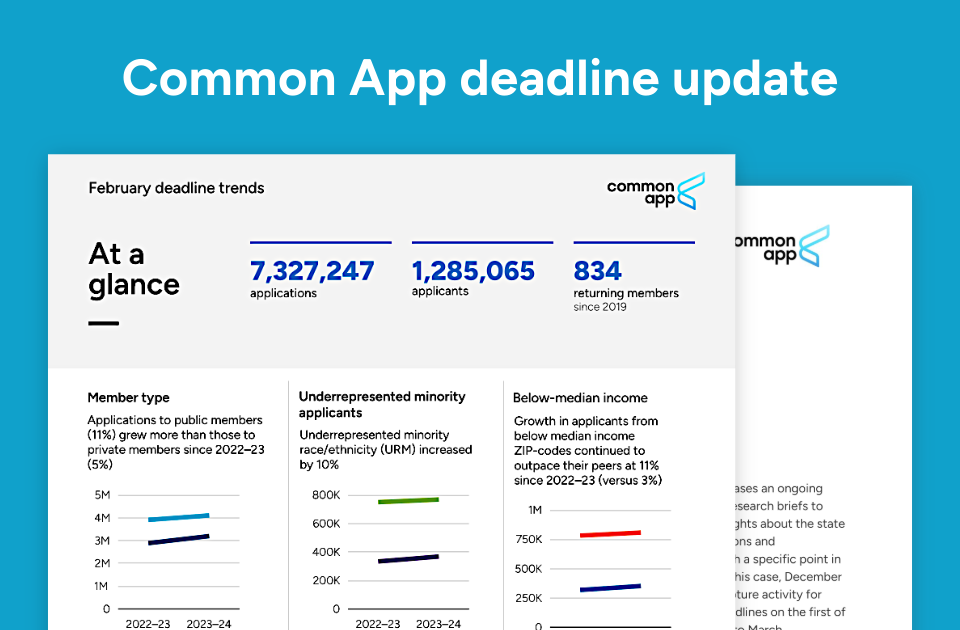
This analysis explores how looking beyond a simple first-generation label to more detailed parental education data provides a clearer picture of student backgrounds. It demonstrates that these nuances can more accurately predict academic outcomes and highlight differences in college readiness among applicants.
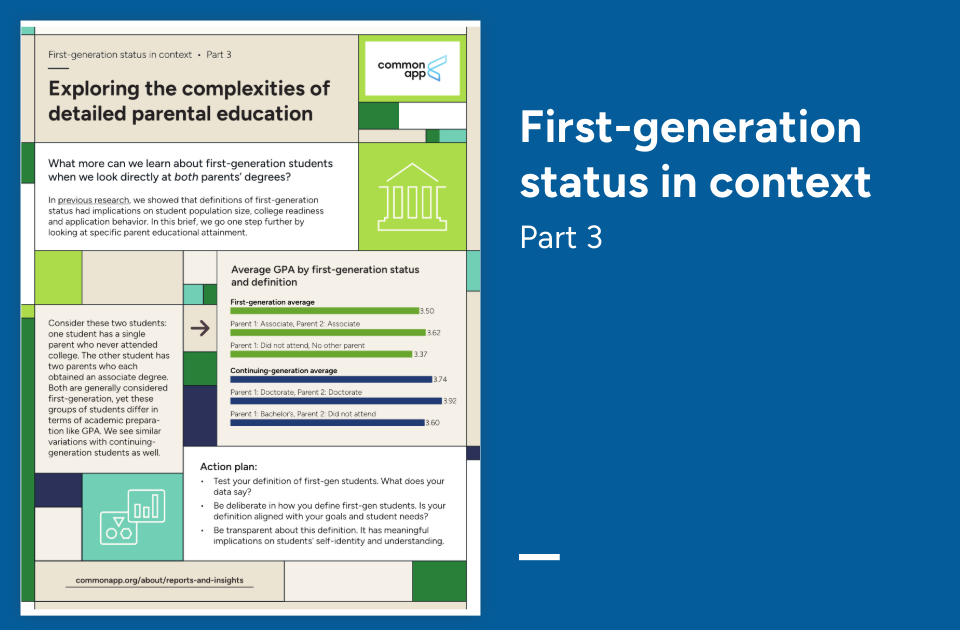
The report provides timely insights on first-year college application trends through February 1. It examines year-over-year shifts in applicant demographics, including race, socioeconomic status, geography, and the types of institutions to which students apply.
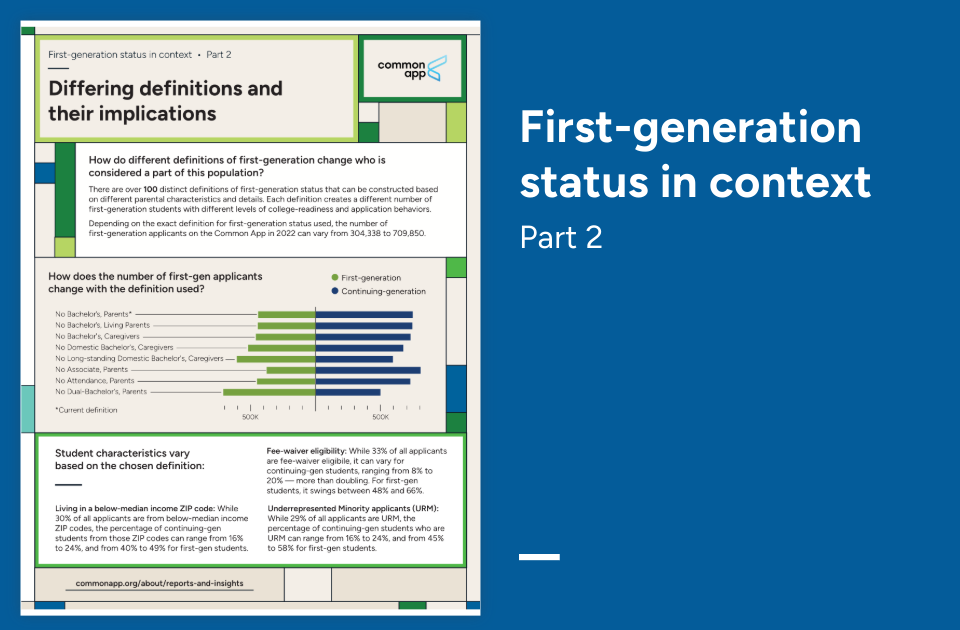
Analysis reveals that the definition of "first-generation" status has a significant impact on the number of students categorized as such. Depending on the criteria used, the number of first-generation applicants can vary from 304,338 to 709,850, influencing perceptions of their college readiness and application behaviors.
The report outlines a commitment to closing the equity gap in college admissions by increasing the number of applicants from low- and middle-income communities. To address underrepresentation, initiatives include expanding membership, providing over $133 million in fee waivers, and enhancing outreach and support for students in need.

The report provides timely insights on first-year college application trends through January 1. It examines year-over-year shifts in applicant demographics, including race, socioeconomic status, geography, and the types of institutions to which students apply.
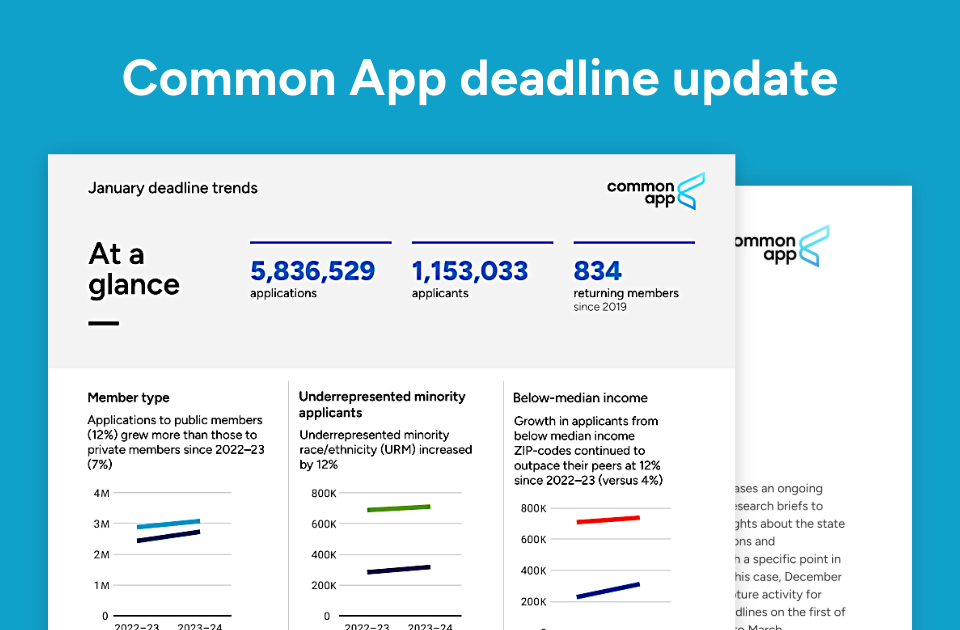
The Common App’s December 2023 update highlights continued growth in college applications compared to the previous year. The report also notes increases among students from historically underrepresented and lower-income backgrounds.
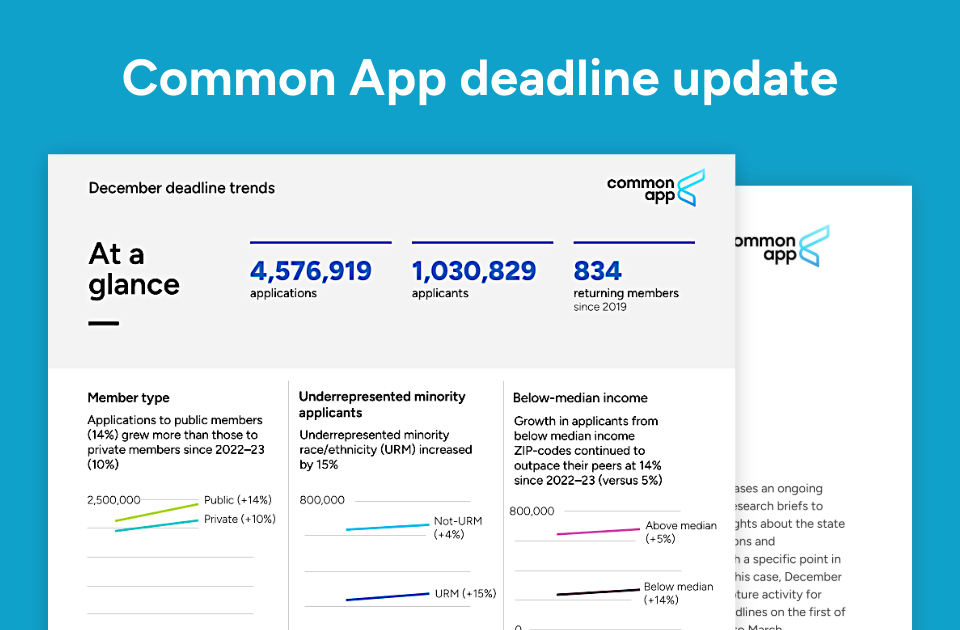
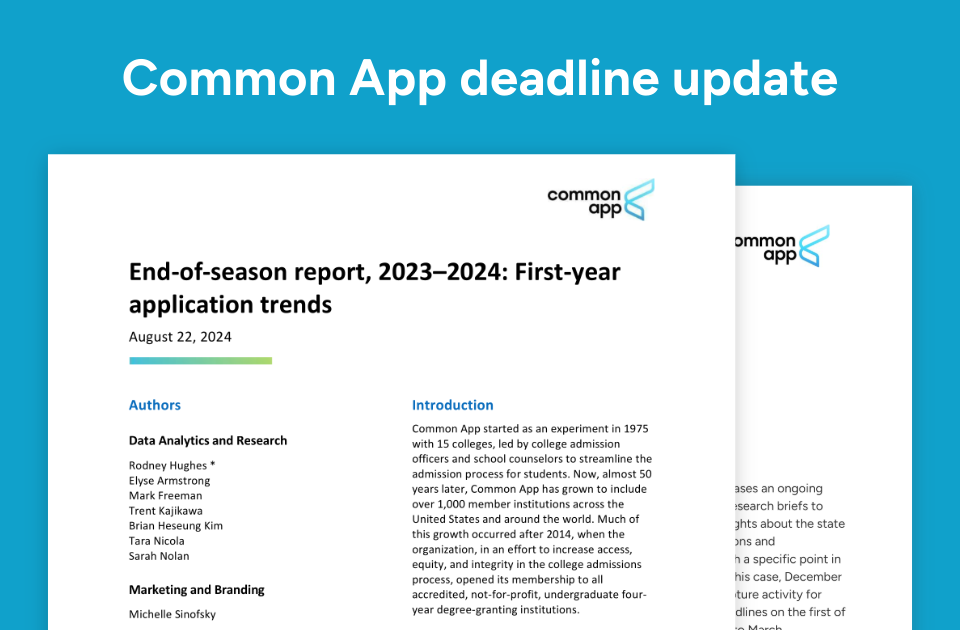
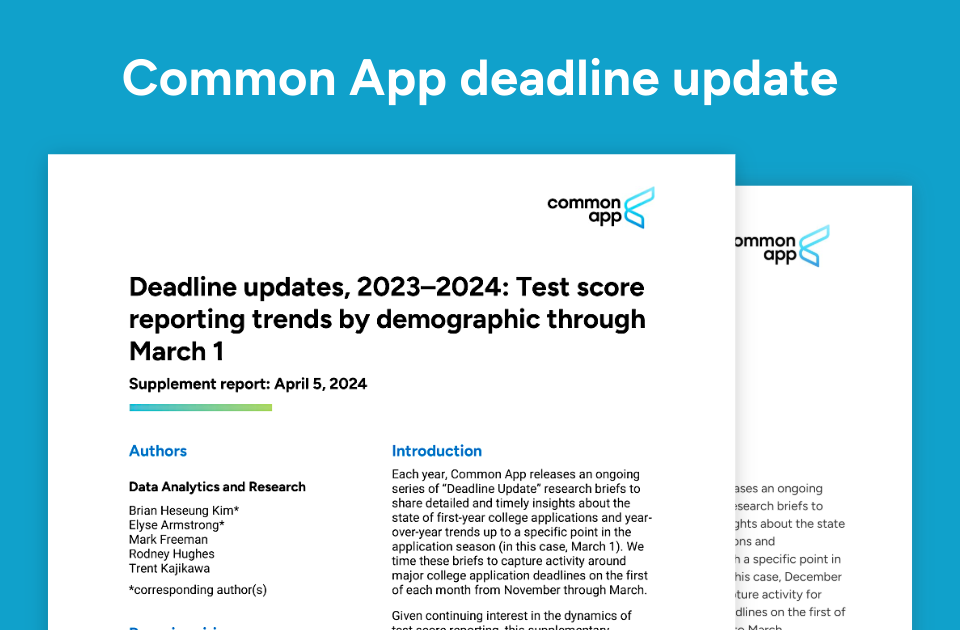
This supplement updates the original November 1, 2023 Common App Deadline Updates report. It provides revised data and a year-over-year comparison to give a more current view of first-year application trends.
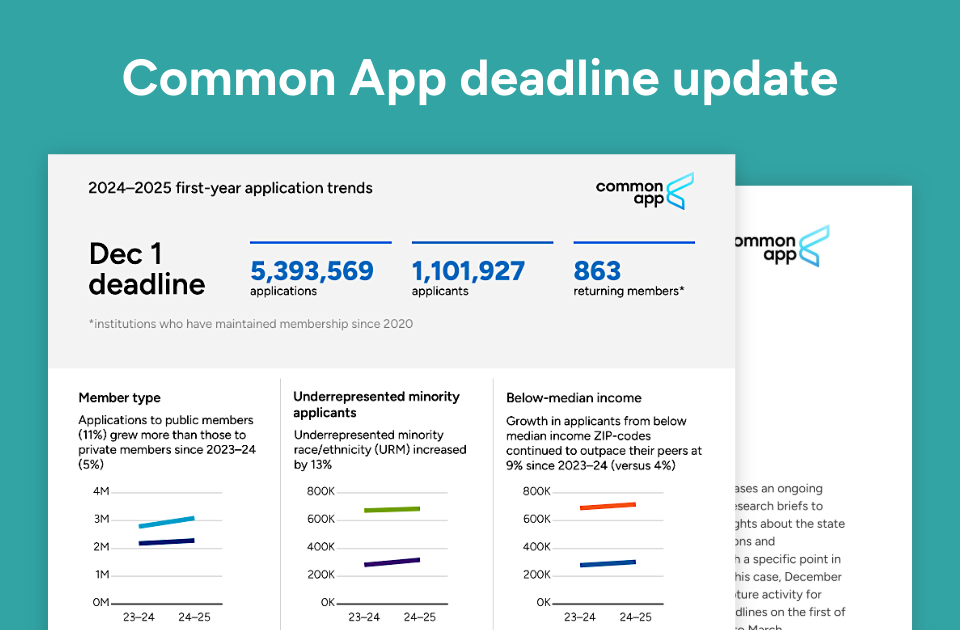
The report provides timely insights on first-year college application trends through November 1. It examines year-over-year shifts in applicant demographics, including race, socioeconomic status, geography, and the types of institutions to which students apply.
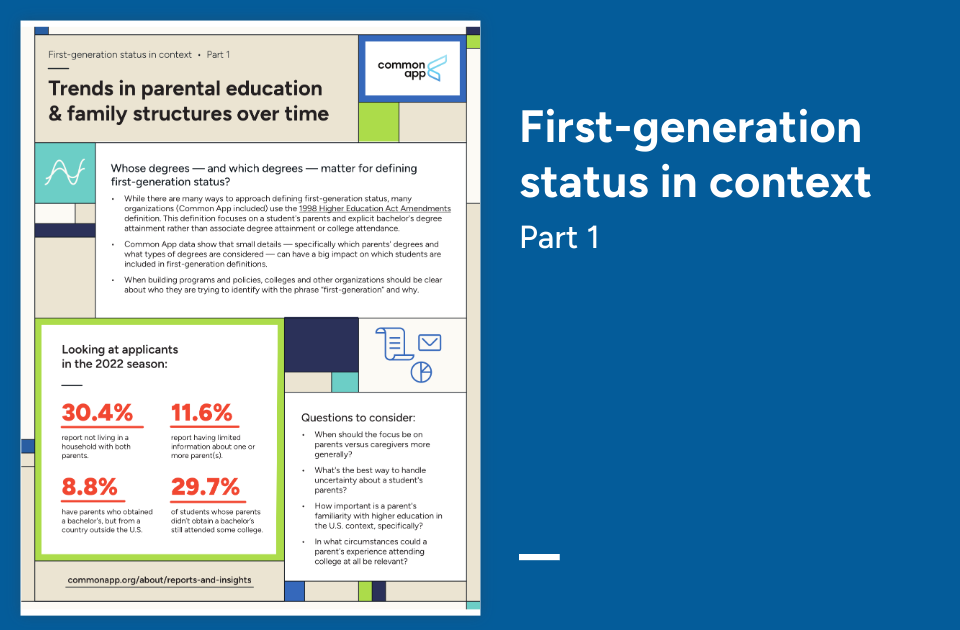
We explored how small differences in defining first-generation status—such as which degrees and whose degrees count—significantly impact who is classified as a first-generation student. These differences have important implications for designing support programs.
Analysis reveals that early admission deadlines, such as Early Decision (ED) and Early Action (EA), have seen increased popularity over recent years. However, significant demographic disparities persist, with students from higher-income and more educated communities more likely to apply early.
An analysis of transfer application trends revealed that, between 2018–19 and 2021–22, the number of account creators on the transfer platform followed a U-shaped pattern. There were over 400,000 account creators in the first year, followed by a slight decline in 2019–20. The number then rose to over 414,000 in the most recent season.
Analysis of over 6 million activity descriptions from approximately 860,000 applicants during the 2018–19 and 2019–20 seasons revealed significant disparities in the reporting of extracurricular activities. Race, socioeconomic status, and first-generation college status influenced both the number and type of activities reported.
Between 2014–15 and 2021–22, the number of international applicants using Common App increased by 63%, with applications rising 109% from 2019–20 to 2021–22. Despite this growth, international applicants consistently made up 4–5% of all Common App applicants across seasons.
This guide helps higher education institutions understand and implement practices regarding name, sex, and gender questions in the college admissions process. It provides definitions for terms such as legal first name, chosen name, legal sex, gender, and pronouns, and outlines how these elements are incorporated into the application.
The analysis examines trends in the number of applications submitted by first-year users of the Common App. Most students submit five or fewer applications. However, a growing number are applying to 15 or more institutions, especially those with higher standardized test scores, international backgrounds, and private high school education.
Within standard race/ethnicity categories, substantial disparities exist in applicant resources, college readiness, and application behaviors. Variations within categories often exceed differences between URM and non-URM applicants. Detailed backgrounds reveal hidden diversity.
Focus on standard race/ethnicity categories obscures significant variations. For example, Asian applicant growth (+71%) masks "Other South Asia" surging (+169%), while Japan declined (-4%). Detailed data reveals dynamic shifts and hidden diversity within groups.
The report highlights growth in the number of diverse applicants between 2013–14 and 2021–22, with notable increases among first-generation, underrepresented minority, and fee waiver-eligible students.
This analysis examines how students’ use of Early Decision, Early Action, Regular Decision, and Rolling Admission varies by demographics and institutional selectivity, revealing that early application pathways are more prevalent among higher-income, White, and continuing-generation students.
The Common App's membership expanded significantly between 2014–15 and 2020–21, growing from 547 to 914 institutions. This growth included a higher proportion of public colleges and larger institutions, reflecting a strategic effort to increase access and equity in the college admissions process.
In the 2020–21 application cycle, nearly 90% of Common App colleges adopted test-optional policies. As a result, fewer students submitted standardized test scores, with submission rates varying by region, socioeconomic status, and college selectivity.
The pandemic deeply affected college applications. In essays, 20% of students shared their COVID-19 experiences, reflecting hardship and growth. Colleges delayed deadlines and went test-optional. Applicants applied later, and test scores were reported at much lower rates than in prior years.
A study of 800,000 students found that large-scale FAFSA “nudge” campaigns had little effect on financial aid receipt or college enrollment, suggesting that strategies effective locally may not scale successfully.

This study examines the relationship between traits such as grit, growth mindset, and self-control, as demonstrated through students’ activities and work, and their impact on college graduation.

In 2017, Pew Research found that most U.S. colleges admitted the majority of applicants. While highly selective schools like Harvard and Stanford received attention for their low acceptance rates, they represented only a small fraction of institutions and enrolled relatively few students.

An examination of admissions practices at selective colleges and universities reveals that high-achieving, low-income students are often disadvantaged, resulting in underrepresentation in elite institutions.